LULC QGIS Zonal Stats Tutorial#
You can easily derive insights about your area of interest from a Land Use Land Cover (LULC) map with just a few lines of code, or a few steps using GIS software.
This tutorial demonstrates how to calculate the percentage of each class type over any area of interest (AOI) from an Impact Observatory LULC map.
Requirements#
- A Land Use Land Cover (LULC) GeoTIFF
- Note that the GeoTIFF must be clipped to the boundary of your area of interest (AOI).
- If your GeoTIFF includes areas where you do not want to count the pixels, you need to clip those areas out using a vector file.
- See Projection Notes for more information on projections for statistics and visual appearance.
- QGIS -- This tutorial uses QGIS, but ArcGIS Online, ArcGIS Pro, or the GDAL library can be used to achieve similar results.
- Spreadsheet -- Google Sheets, Microsoft Excel, other
Outputs#
- Pixel counts for LULC class over the AOI
- Percent of each class throughout the AOI
- A table, donut chart, and/or histogram of the results
Calculating Class Percentages#
Open data in QGIS#
Open the GeoTIFF in QGIS.
This tutorial can be used to analyze any of the three output GeoTIFFs from the IO Monitor. The example below shows a LULC map clipped to the extent of Miaoli County, Taiwan in QGIS for the 90-day date range 2022-11-01 to 2023-02-01.
Raster Layer Unique Values Report#
- In QGIS, open the Processing Toolbox → Raster analysis → Raster layer unique values report.
- In the pop-up window, select your GeoTIFF for the Input layer.
- Optional: specify a location to save the report and a table format of the report using the button with three dots next to “Unique values report [optional]” and “Unique values table [optional].” If you do not specify a location your output will be saved to a temporary file, which is recommended.
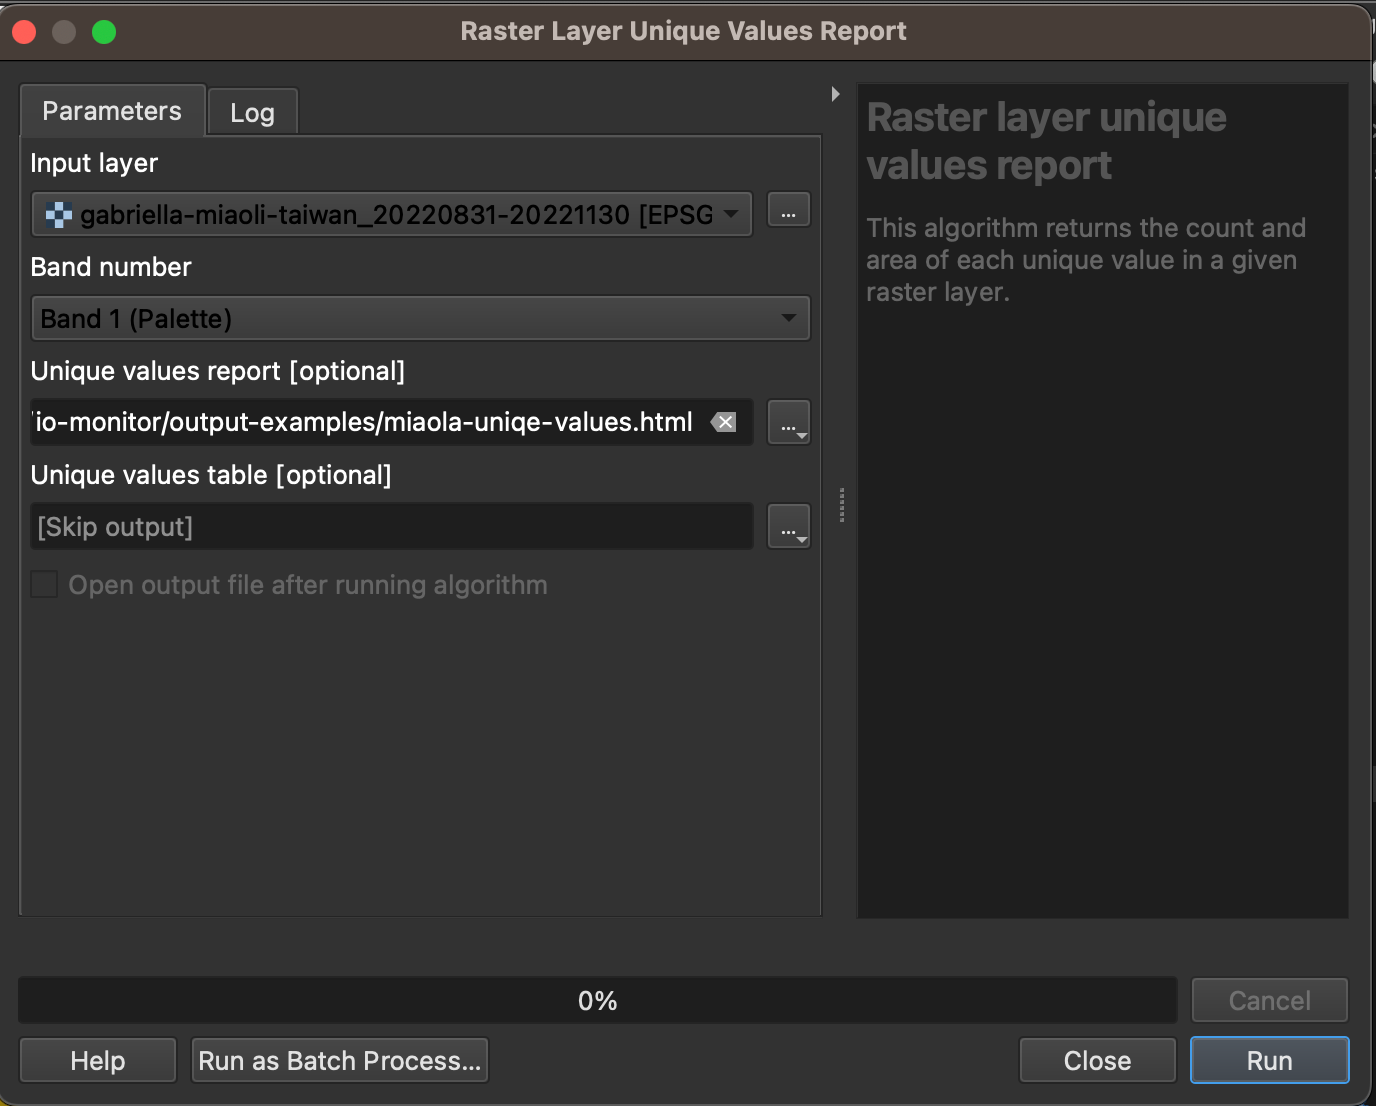
- Click Run
After the statistics are complete, another pop-up window will appear like the one below. Click on the file path.
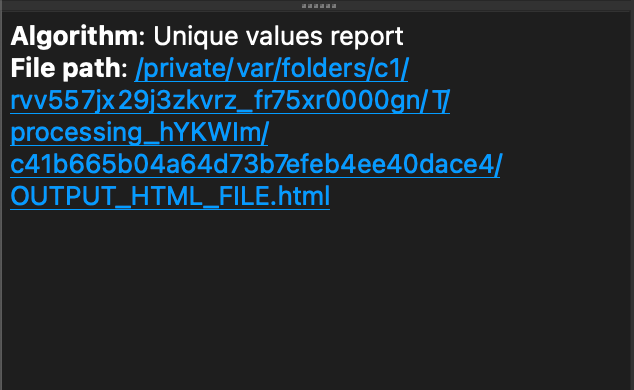
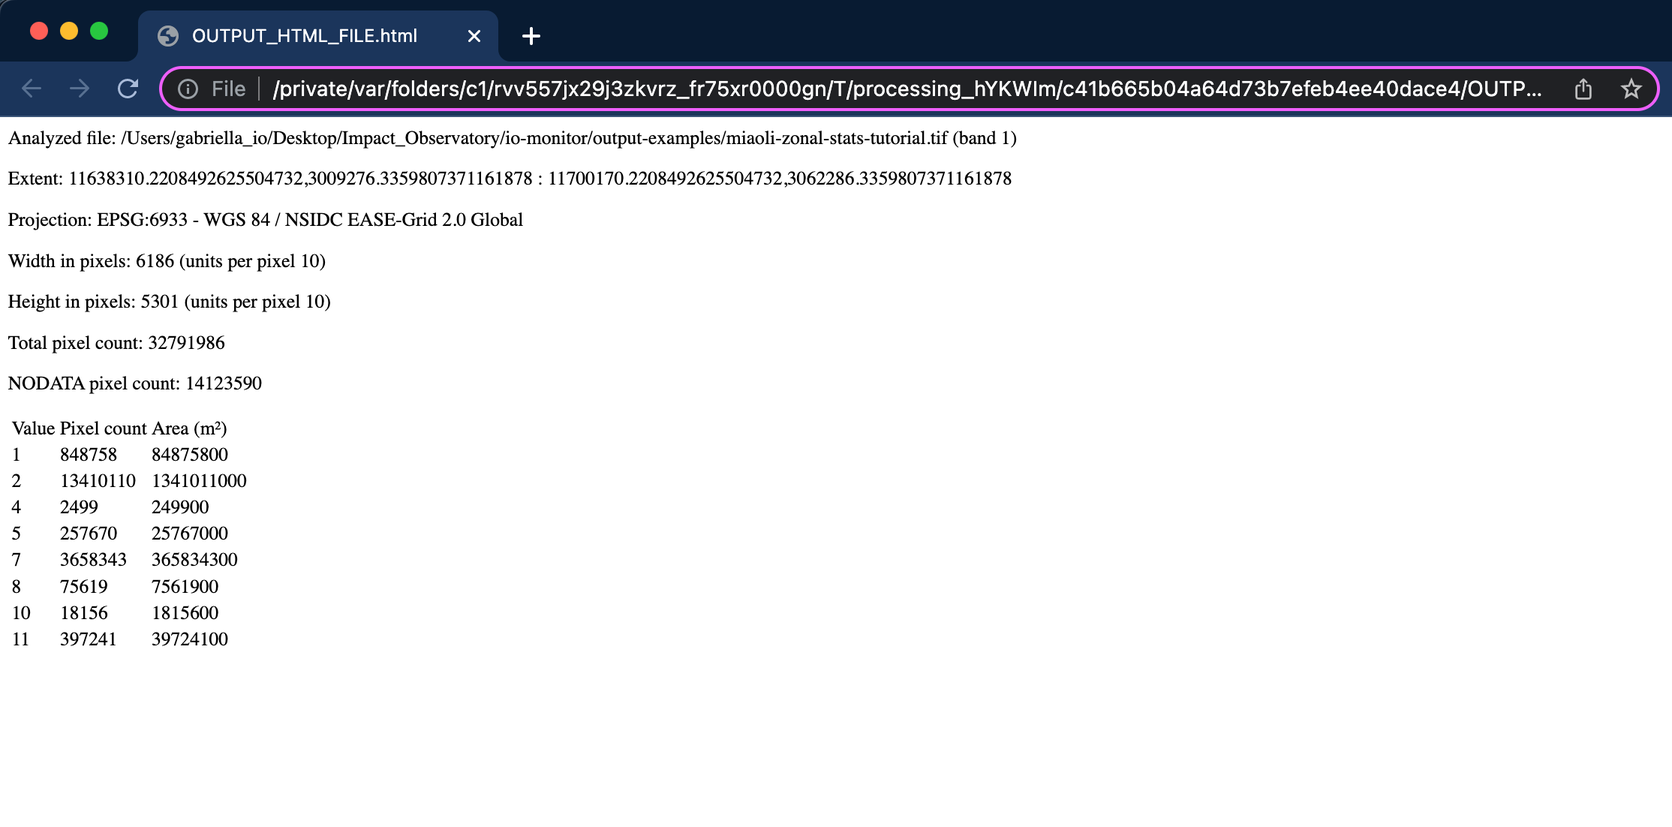
Clicking on the file path will open a page in your browser with the unique values report.
Creating a report in a Spreadsheet#
Copy and paste the values from the unique values report into a spreadsheet to conduct additional analysis. Use this Google Sheets Zonal Statistics Example as a template for your report (make sure when pasting to right click → “paste values only” to keep the table format of the data). You can also follow the tutorial below to create your style of report.

Understanding the Results#
Each pixel value aligns with the 9 LULC classes. Note that the values of 3 and 6 do not exist in any LULC maps from IO Monitor because these values have been combined into the rangeland class. Also note that most places will not have any snow/ice, or pixel values of 9 unless snow/ice is permanent.