Metrics
Metrics provide answers and insights about an area of interest is a quantifiable way that visuals just can't do. Metrics are a simple way to derive value from geospatial data by calculating the total square kilometers of each land cover class within an area of interest. For this reason, every order from the IO Store includes a CSV file for immediate insights.
A CSV file format allows end users to share insights in various forms, such as incorporating data into technical workflows, creating charts and graphs to visualize the data, and providing information to add to reports.

Metric are also calculated for Change Maps to show the total square kilometers of change detected over one year. Note that in a Change Map, if a pixel for a given land cover class stays the same, then it is shown as that same class. Therefore, metrics for change maps also show the total square kilometers of each land cover type that did not change. To calculate gain or loss of a given class, you should subtract older map (baseline metric) amounts from the newer map (custom LULC metric) amounts.
How are metrics calculated?#
The percent of pixels taken up by each land cover class is multiplied by the total square kilometers of the Area od Interest (AOI) to estimate the square kilometers of each land cover class.
For example, if we know an AOI is 3,350 square kilometers, and 20% of the pixels in the AOI's land cover map are "dense trees," then there are roughly 670 square kilometers of "dense trees."
The total area of the AOI is based on the open source geojson-area repository, which uses the Mercator EPSG: 4326 WGS 1984 projection with a conversion on the fly.
Use Case: Tracking changes in Coolidge, Arizona using 3m Land Cover#
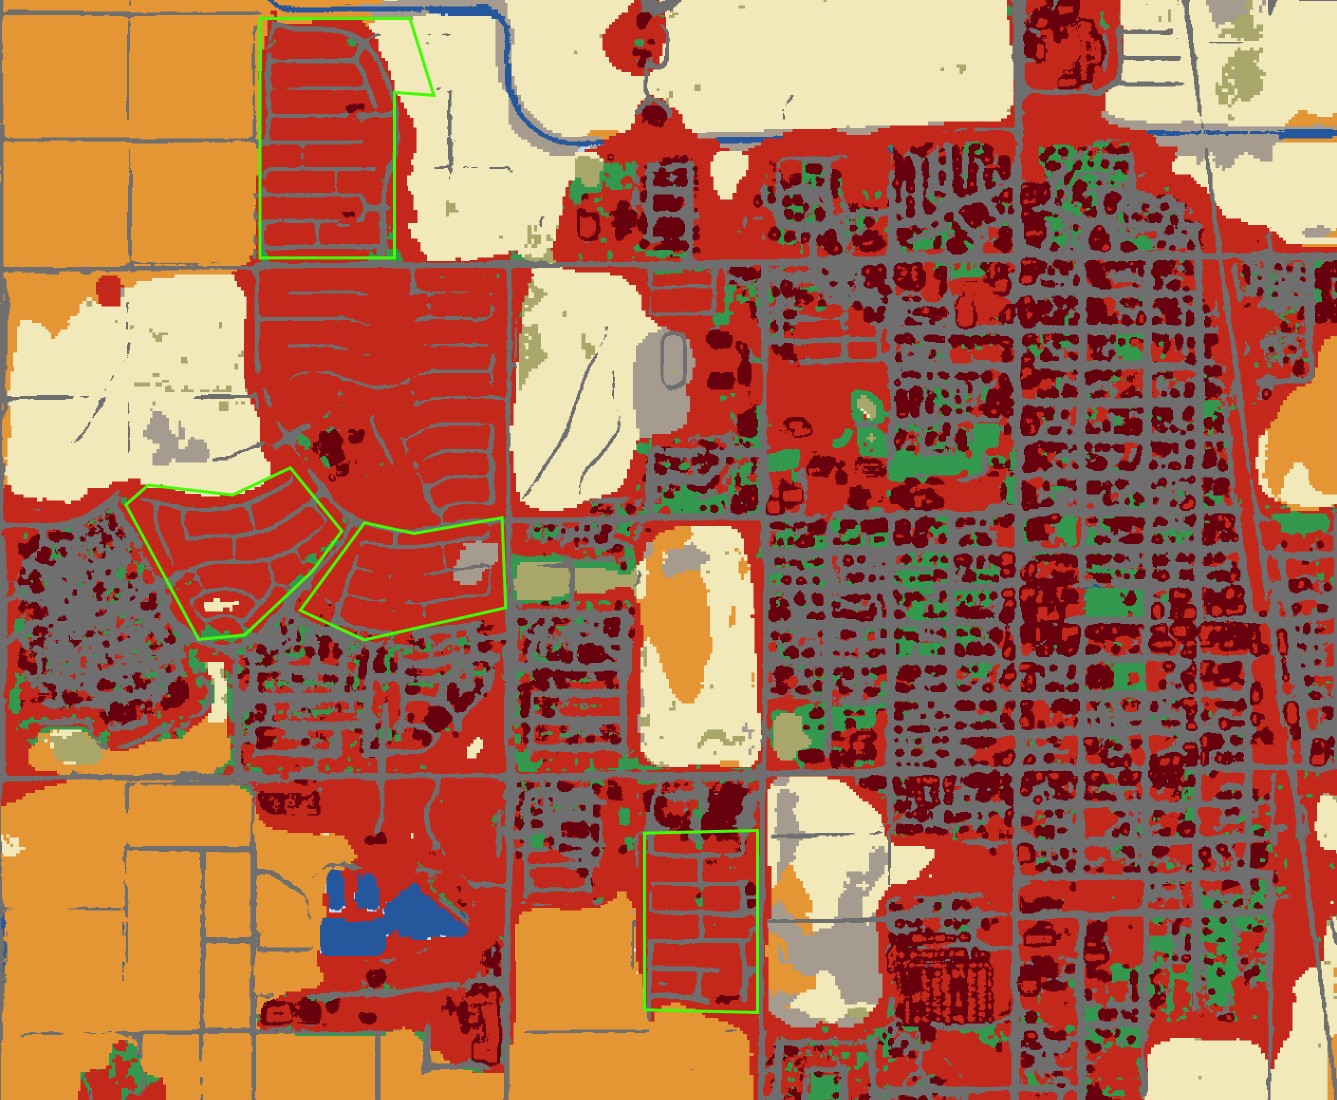
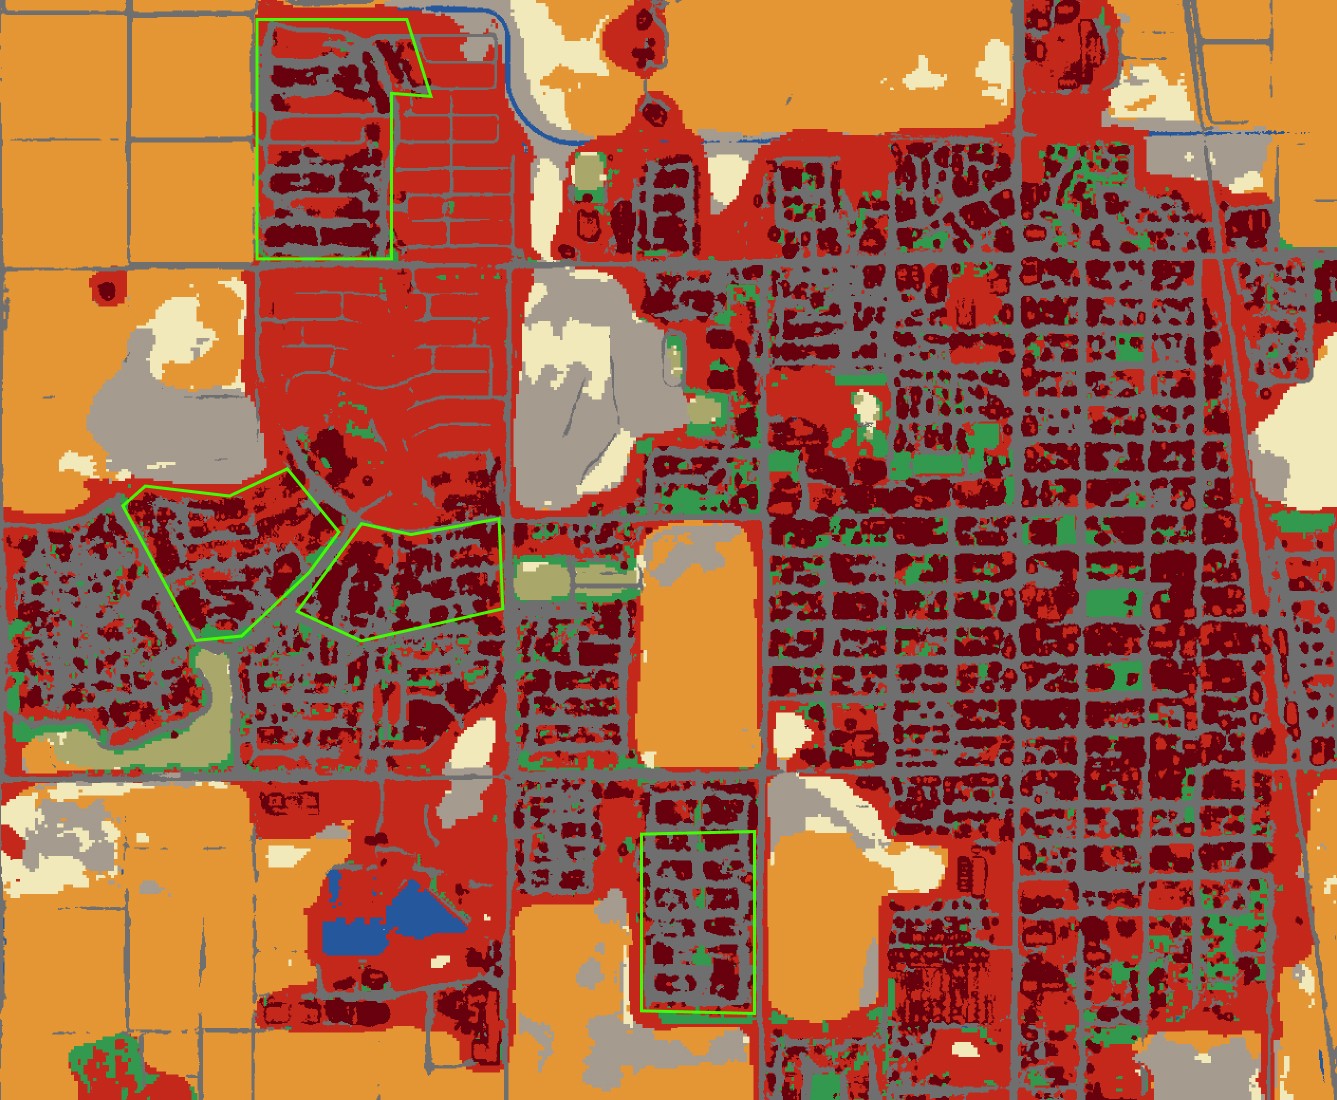
3m land cover metrics
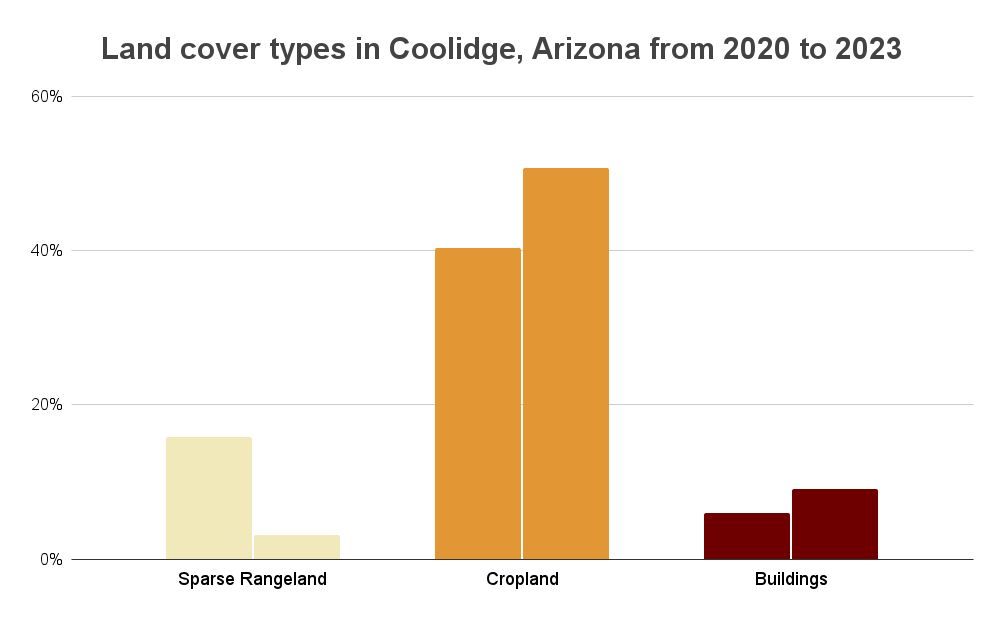
3m Land Cover data from 2020 and 2023 reveals new cropland growth and building construction in Coolidge, Arizona, USA. Metrics calculated by Impact Observatory show the number of square kilometers that changed the time frame. These metrics are essential to monitor how land is used over time to enable data-driven decision-making and support sustainable development.