IO Monitor 10m Land Cover#

What is included in a 10m Land Cover order?#
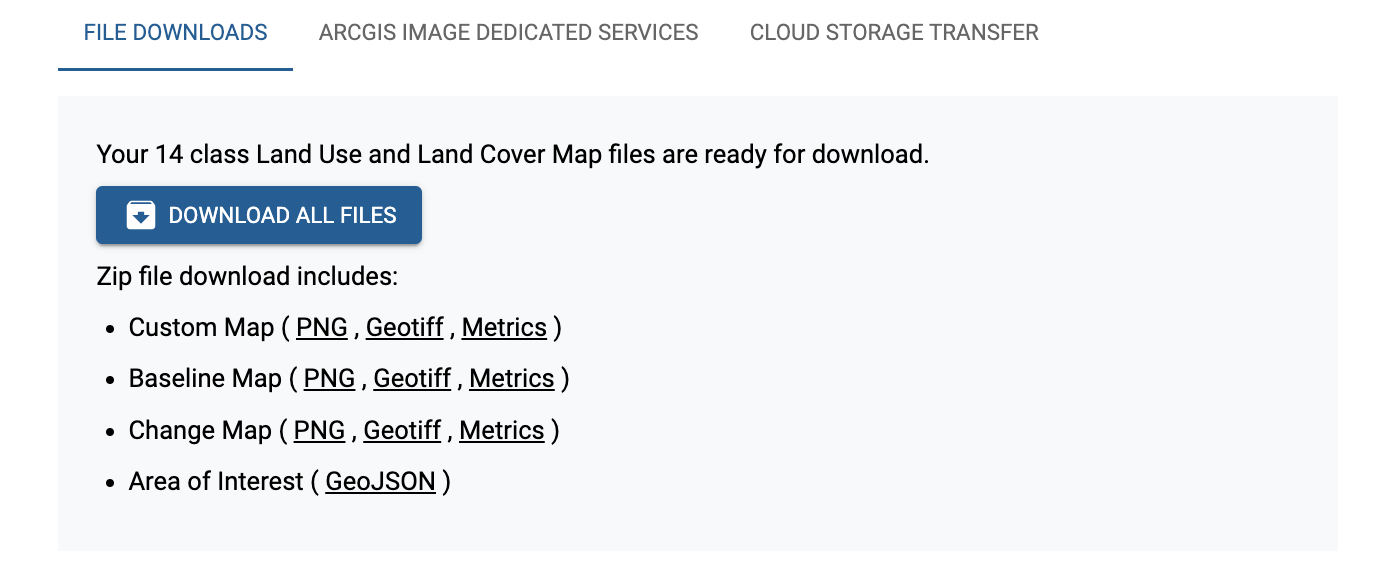
Every order for 10m Land Cover Maps from IO Monitor includes three land cover maps available as a png file and Cloud Optimized GeoTIFF file. Metrics are provided in a CSV file for each land cover map. Read more about insights from land cover metrics. The Area of Interest is provided as a GeoJSON. Files can be downloaded as a zip or individually from the Download Manager.

What are the three maps included in each 10m Land Cover order?#
-
Custom Map: a 10m Land Cover map using the exact date range specified by the customer, available as a PNG and GeoTIFF. Metrics are provided in a CSV file showing the number of square kilometers of each land cover class in the AOI.
-
Baseline Map: a 10m Land Cover map of the same date range from the previous year, available as a PNG and GeoTIFF. A map of the previous year is included with every order to provide insights into any possible land cover changes in the AOI. Metrics are provided in a CSV file showing the number of square kilometers of each land cover class in the AOI.
-
Change Map: a 9 class 10m Land Cover map with an additional class for change, highlighting differences between the Custom Map and the Baseline Map, available as a PNG and GeoTIFF. Read more about Change Maps. Metrics are provided in a CSV file showing the number of square kilometers of each land cover class in the AOI.
-
The Area of Interest (AOI) specified by the customer is available as a GeoJSON file.
How are land cover maps used?#
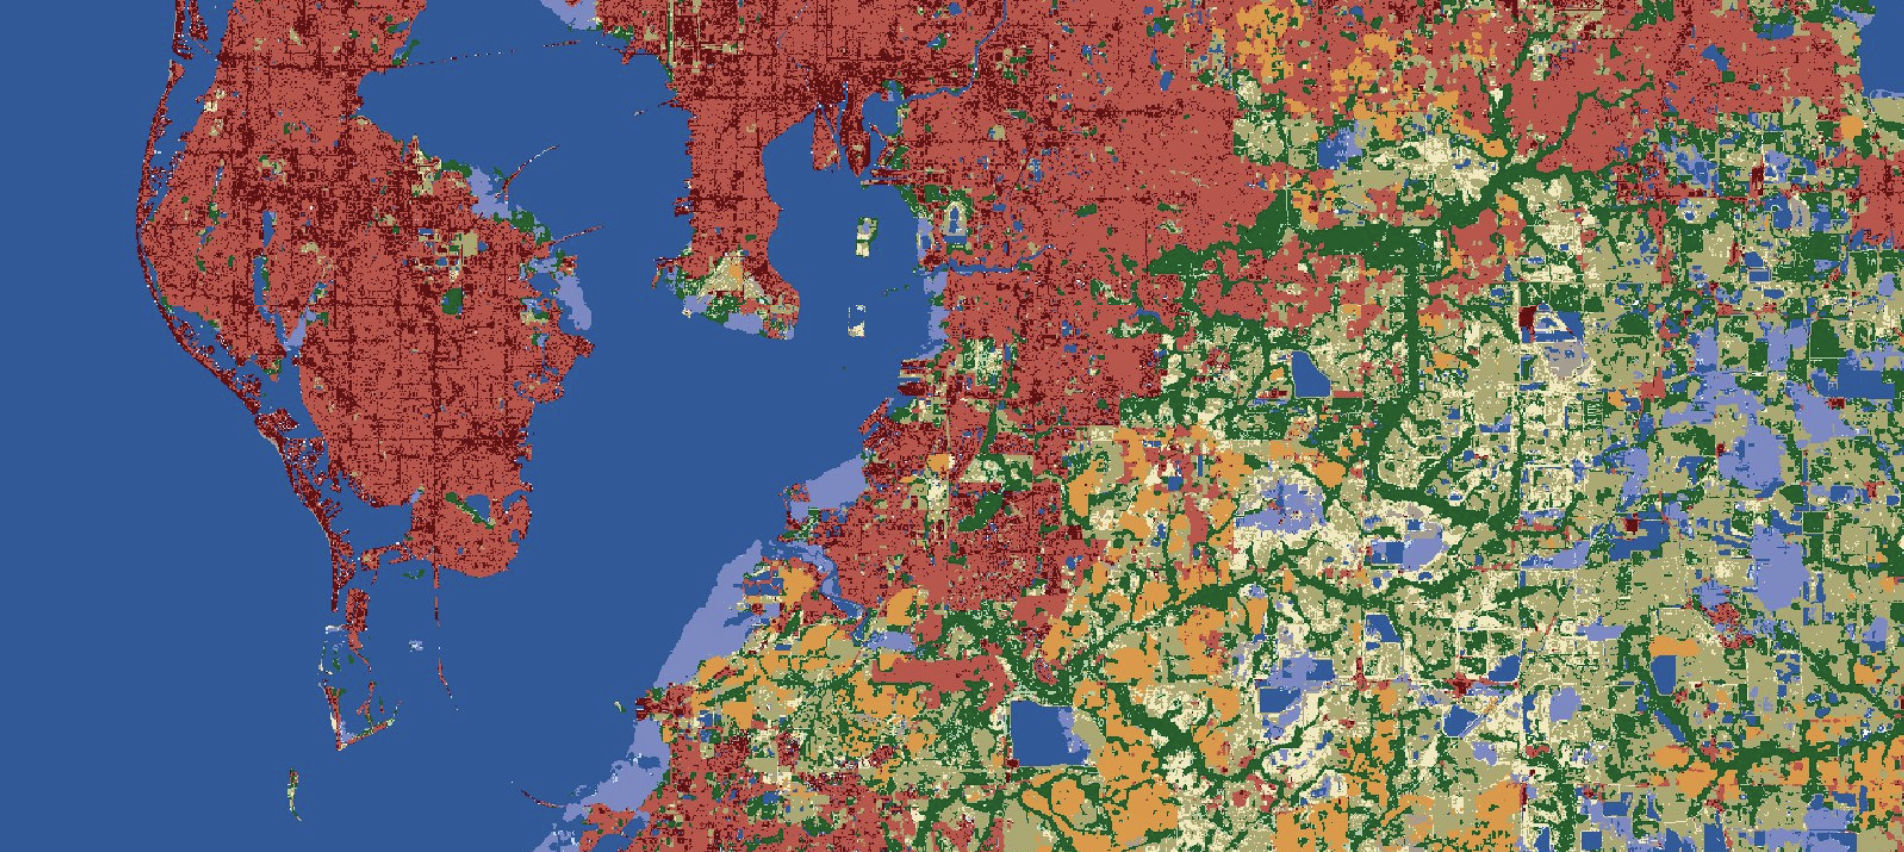
High-resolution land use and land cover (LULC) maps are used to inform environmental decision-making. By classifying land cover types, Impact Observatory maps provide a basis for a long list of use cases related to land use planning, resource management, and environmental protection. High-resolution LULC maps are also valuable tools for identifying areas undergoing significant change, such as deforestation, urbanization, and habitat loss. In return, these maps can be used to develop impactful conservation strategies. You can learn more about Impact Observatory's data products on [our website] or from our medium post, ["Mapping the world with unmatched frequency.”]
Examples of our maps in action include an article in the New York Times showing the impact of flooding on cropland in Pakistan and by Esri to map of the world's greenest megacities.
Our annual global land use & land cover Maps for Good are available for 2017 through 2023 to download for free (CC BY 4.0) from the IO Store and from our partners including the Esri Living Atlas, AWS Open Data Registry, and Microsoft's Microsoft Planetary Computer.
All Impact Observatory 10m Land Cover maps use the following taxonomy to create a seamless map of land types.
Land Cover Classes#

Land Cover Class Definitions#
| Class Name | Description |
|---|---|
| Water Channel Extent | Full extent of water under normal circumstances (maximum long-term footprint outside of flooding or other exceptional events). Covers areas like lake beds and arroyos where water might be present regularly, but only seasonally. |
| Variable Water | Intermittent water flow or standing water, representing seasonal fluctuation in cover, weather events, or human activities. At times this class may occur due to frequent turbidity, algal blooms, ice cover, pollution, or glare. |
| Persistent Water | Sustained water flow or standing water, representing permanent or sustained seasonal cover. |
| Snow/Ice | Large, homogenous areas of persistent snow or ice, typically only in mountain areas or high latitudes. |
| Bare Ground | Areas of rock or soil with very sparse to no vegetation for the entire year; large areas of sand with little to no vegetation; examples: exposed rock or soil, desert, dry salt flats, dry lake beds. |
| Sparse Rangeland | Vegetation that is some mix of grasses and/or dispersed, short, woody scrub, with or without some bare ground cover. May contain small isolated trees. Defined as a rangeland prediction with a maximum NDVI value less than a biome-specific threshold during the given time period. |
| Dense Rangeland | Healthy, closely packed vegetation that is predominantly dense, short (under 5m) woody shrubs with very little to no mixed grass or bare ground cover. May contain small isolated trees. Within and around areas classified as built, this class can also include highly manicured lawns or fields. Defined as a rangeland prediction with a maximum NDVI value greater than or equal to a biome-specific threshold during the given time period. |
| Flooded Vegetation | Areas of vegetation with obvious intermixing of water throughout the majority of the given time period; mostly herbaceous (non-woody) vegetation and/or scattered tree (mangrove)/scrub/shrub cover. Thick mangrove, swamp, or seasonal wetland may fall under their next-best-fit vegetation classes if water is not observed during the given time period. |
| Sparse Tree | Vegetation that is predominantly tree canopy cover (vegetation over 5m high) with some mixing of other vegetation or bare ground due to relatively thin leaf cover and/or dispersed distribution of trees. In some circumstances this class can also indicate trees gaining/losing leaves or dying/growing during the given time period. Defined as a tree prediction with a maximum NDVI value lower than a biome-specific threshold during the given time period. |
| Dense Tree | Healthy, closely packed tree canopy cover (vegetation over 5m high) with very little to no vegetation or bare ground cover. Defined as a tree prediction with a maximum Normalized Difference Vegetation (NDVI) value greater than or equal to a biome-specific threshold during the given time period. |
| Inactive Cropland | Fallow or otherwise inactive fields, sometimes mixed with small infrastructure in close proximity of active crops. |
| Active Cropland | Actively growing crops, irrigated pastures, and other vegetation actively managed by humans. |
| Low Density Built | Artificial impervious surfaces, buildings, and structures mixed with vegetation that cannot be easily detangled at 10m-resolution. These areas typically represent low-density residential areas, suburban areas, large path networks or other dispersed human construction. Defined as built area with a maximum NDVI value greater than or equal to a biome-specific threshold. |
| High Density Built | Artificial, impervious surfaces in the form of individual features, parts of features, or tight clusters of features with little to no mixed vegetation or bare ground. Isolated clusters of these detections represent small buildings or construction, while larger clusters are indicative of commercial, industrial, or high-density residential areas. Defined as built area with a maximum NDVI value less than a biome-specific threshold. |
| Clouds | No land cover information due to continual cloud cover. |
LULC Class Colors#
| Raster Value | Class Label | Hex Color Value |
|---|---|---|
| 0 | No Data | #000000 |
| 11 | Water Channel Extent | #ffffff |
| 12 | Variable Water | #bfdaf5 |
| 13 | Persistent Water | #25579d |
| 30 | Snow/Ice | #a8ebff |
| 40 | Bare Ground | #a59b8f |
| 61 | Sparse Rangeland | #aecca1 |
| 62 | Dense Rangeland | #a9a76a |
| 80 | Flooded Vegetation | #7a87c6 |
| 101 | Sparse Trees | #f1e9b9 |
| 102 | Dense Trees | #005e24 |
| 141 | Inactive Cropland | #E4B479 |
| 142 | Active Cropland | #CB852F |
| 172 | Low Density Built | #c44d45 |
| 174 | High Density Built | #67000d |
| 240 | Clouds | #616161 |
LULC GeoTIFF Technical Specifications#
| Name | Specification |
|---|---|
| File Type | Cloud Optimized GeoTIFF (COG) |
| Compression | LZW |
| Projection | EPSG:3857 - WGS 84 / Pseudo-Mercator – Spherical Mercator |
| Extent | Custom to user-selected area of interest |
| Resolution | 10 meters |
| Data Type | 8-bit unsigned integer (uint8) |
| No data value | 0 |
Legal#
All IO Monitor maps are governed by our End User License Agreement.