Change Maps from IO Monitor#
What is a Change Map showing?#
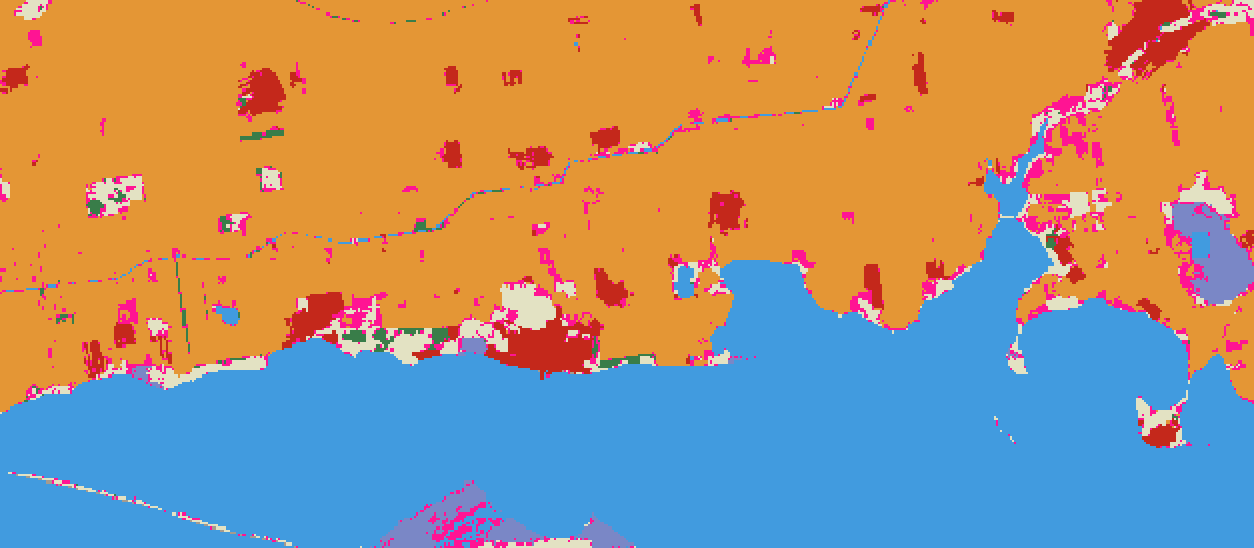
IO Monitor orders provide two land use and land cover (LULC) maps over the same area that can be compared with one another. Naturally, a map of changes can be derived by comparing two maps over the same area from different time periods. A change from one land cover type to another can reveal insights and activity in your region, such as deforestation, desertification, or urban expansion.
When you place an order for 10m Land Cover maps from IO Monitor, you are also provided a land cover map of the same date range from the previous year over the same area.
A Change Map is also created to highlight areas where land cover classifications differed from one time period to the next.
Note that sufficient Sentinel-2 data is not available before 2017, so a change map cannot be provided for an order on 2017 data.
Why is a Change Map included in my IO Monitor order?#
Impact Observatory aims to reveal planetary insights through AI-powered land cover mapping. Change Maps are included to generate user feedback on what is helpful to you and your team when interpreting and analyzing LULC data. Impact Observatory aims to help decision-makers understand land changes with our data products, but we need user feedback to build products to cater to your needs.
How is a Change Map produced?#
In general, a Change Map should be used to highlight where changes might have occurred over time. However, the logical next step is to analyze exactly how the land changed from one year to the next. For example, a pixel classified as “trees” that changes to “bare ground” could be evidence of deforestation, or a pixel classified as “bare ground” that changed to “high density built” in a later map could be evidence of urbanization. We leave this as an exercise for the user.
What do the values in a Change Map represent?#
-
If the land cover class in the before and after maps is the same, then the class in the Change Map is assigned the same value for the same land cover class. Therefore, all values excpet for 255 in a Change Map indicate the model detected no changes over time.
-
If the land cover class in the before and after maps are different, then the class in the Change Map is assigned a value of 255 for "Change."
-
If the land cover class in either the before or after maps is "Clouds," then the class in the Change Map is assigned a value of "240" for "Clouds."
-
If the land cover class in either the before or after maps is "No Data," then the pixel in the Change Map is assigned a value of "0" for "No Data."
| Raster Value | Land Cover Class | Hex Color Value |
|---|---|---|
| 0 | No data | #000000 |
| 14 | Water | #419bdf |
| 34 | Snow/Ice | #a8ebff |
| 44 | Bare Ground | #a59b8f |
| 64 | Rangeland | #e3e2c3 |
| 84 | Flooded Vegetation | #7a87c6 |
| 104 | Trees | #397d49 |
| 144 | Crops | #e49635 |
| 174 | Built Area | #c4281b |
| 240 | Clouds | #616161 |
| 255 | Change | #ff1493 |
Known Limitations#
Results of the Change Maps are experimental and not intended to be used without on-the-ground confirmation of a genuine land change.
No modeled LULC map is 100% correct; this holds for the Change Maps as well. IO Monitor LULC maps have an average accuracy of 85%, globally. For a change at a given location to be properly classified, both the before and after maps must be correct. Therefore, the Change Maps will have lower accuracy. Importantly, different types of change may be more or less accurate than others.
Change Map Class Definitions#
Change Maps currently detect differences across our original 9 land cover categories. Our 9 land cover clsses are defined in detail on our website. Future products may provide changes across our 10m Land Cover classes using sub-annual date ranges to compare seasonal differences.
Change Map Technical Specifications#
| Name | Specification |
|---|---|
| File Type | Cloud Optimized GeoTIFF (COG) |
| Compression | LZW |
| Projection | WGS 84 / Pseudo-Mercator -- Spherical Mercator |
| Extent | Custom to user-selected area of interest |
| Resolution | 10 meters |
| Data Type | 8-bit unsigned integer (uint8) |
| No data value | 0 |
Feedback#
Impact Observatory aims to empower decision-makers with timely, actionable data on land cover change. We want to hear from you. How would your team like to use land use and land cover maps? Let us know by reaching out to [hello@impactobservatory.com].